
There’s no doubt that the NCLEX can be stressful, especially when there are barriers to being able to comprehend, apply and analyze highly technical concepts and nursing skills. Over the years, a lot of my clients and students have struggled with answering questions that involve ECG interpretation. As a result, I’ve decided to create a three-part blog series that will help you to gain the strategies necessary to master ECG interpretation on the NCLEX.
In part one, we discussed important terms and concepts about the conduction system of the heart and fundamental components of an ECG strip. In this part two, we are going to review analyzing and measuring the different components of a ECG rhythm strip.
Interpreting ECG Rhythm Strips
Measuring and Analyzing the ECG can be an easy task, once you practice doing so on a daily basis. By learning a simple five-step systematic approach, you will be able to master ECG rhythm strip interpretation in a heartbeat!
The five step approach, in order of application, includes assessment and analysis of the following:
- Heart rate
- Heart rhythm
- P waves
- PR interval
- QRS complex interval
Step 1 – Determining the Heart Rate
The first thing we need to do is count the number of electrical impulses as represented by PQRST complexes conducted through the myocardium in 60 seconds (1 minute).
- For atrial rate: Count the number of P waves
- For ventricular rate: Count the number of QRS complexes
Here are two known methods to determine the heart rate.
- The 6 second method
- Using the rate determination chart
For the 6 second method, we denote a 6 second interval on the EKG strip. The strip is marked by 3 or 6 second tick marks on the top or bottom of the graph paper. Then, you count the number of QRS complexes occurring within the 6 second interval, and then multiply that number by 10.

This is a sample of an ECG reading on a 6 second strip. The space between each of the ticks located on the bottom of the ECG strip represents 1 second. In the strip, we have 8 QRS complexes. We take that number and multiply it by 10. There, the rate is 80 beats per minute.
The next method is using the rate determination chart. This is the preferred method for calculation of the heart rate. To do this, you must first count the spaces between the top of each R wave. Afterwards, you can find the number of spaces on the chart to determine the rate.

This is the rate determination chart. What is seen here is a list of the number of spaces with their corresponding rate.

In order to accurately measure the heart rate using the determination chart, the first step is to count the small boxes between the two R waves. As you can see here, the number of boxes is 15. Then we look back at the chart and locate the corresponding heart rate for 15 spaces, you can see that 15 spaces is equivalent to 100 beats per minute.
Step 2 – Determining the Heart Rhythm
Rhythm is sequential beating of the heart as a result of the generation of electrical impulses. It can be classified as:
Regular pattern: Interval between the R waves is regular
Irregular pattern: Interval between the R waves is not regular
In identifying the rhythm pattern, you must measure the intervals between R waves (measure from R to R). If the intervals vary by less than 0.06 seconds or 1.5 small boxes, then the rhythm is considered to be regular. And if the intervals between the R waves (from R to R) are variable by greater than 0.06 seconds or 1.5 small boxes, then the rhythm is considered to be irregular.

As you can see with the rhythm above, the interval between the R waves is not consistent throughout the 6 second strip – thus being defined as an irregular pattern.
Step 3 – Analyzing P Waves
The third step in interpreting an ECG reading is to analyze P waves. In analyzing P waves, we need to ask these 5 questions:
- Are P waves present?
- Are P waves occurring regularly?
- Is there one P wave present for every QRS complex present?
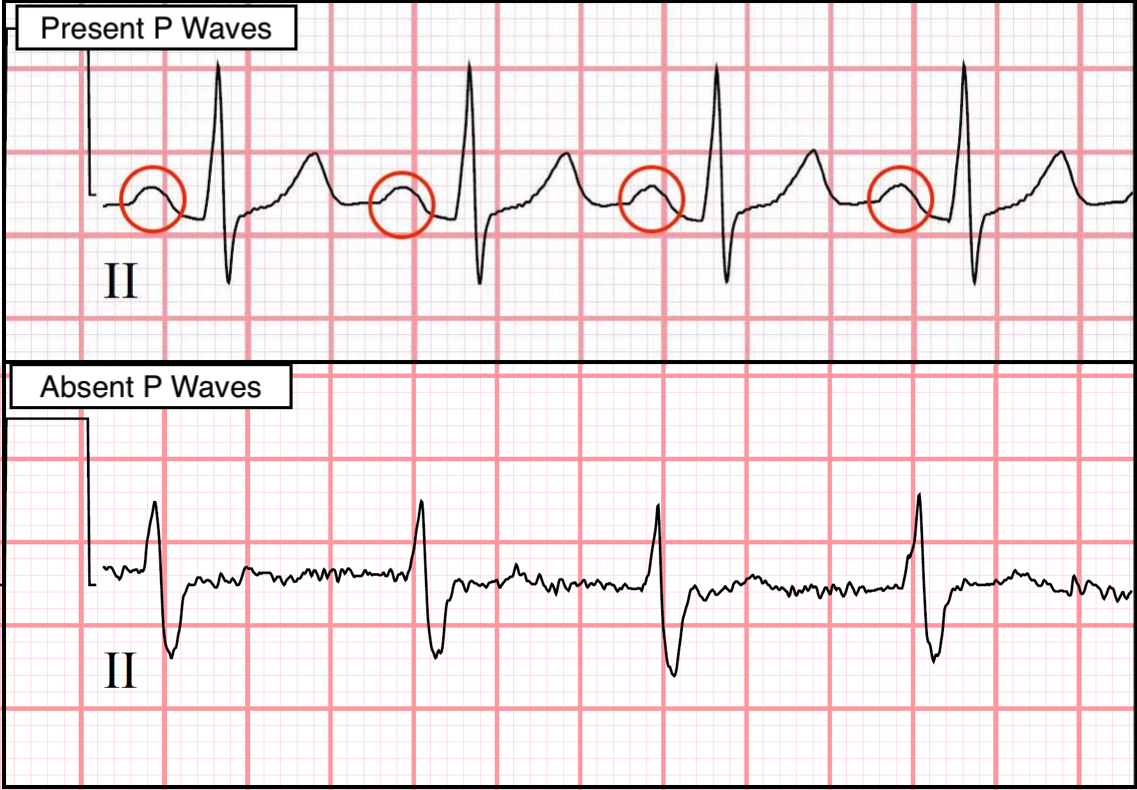
If P waves are absent, or not occurring regularly – then you have identified an abnormal ECG rhythm strip and will need to further analyze to identify the problem. The image below shows what normal P waves and absent P waves look like.
Step 4 – Measuring the PR Interval
The PR interval is the time interval from the onset of atrial contraction to onset of ventricular contraction. It is measured from onset of P wave to the onset of the QRS complex. The normal PR interval is 0.12 – 0.20 seconds (3-5 small boxes. Basically what you are measuring is how long it takes (in time) for the electrical impulse to travel from the SA node to the AV node within the conduction system of the heart. It is important to understand that the longer the time, the slower the heart rate.

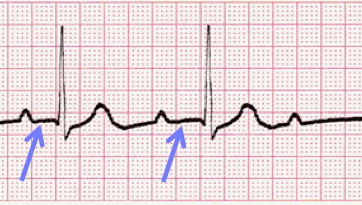
In this illustration above, the red lines indicate where you would measure the PR interval (from the beginning of the P wave to the beginning of the R wave).
In measuring PR intervals, we need to ask ourselves 3 questions:
- Are the PR intervals greater than 0.20 seconds?
- Are the PR intervals less than 0.12 seconds?
- Are the PR intervals consistent across the EKG strip?
If the PR interval is greater than 0.20 seconds then you are likely interpreting a heart block. If the PR interval is less than 0.12 seconds, then you are likely interpreting a tachycardia. If the PR intervals are not consistent throughout the 6 second strip, then you are likely interpreting second degree type I heart block (Wenckebach) – but we will get into this in more detail in part three..
As you can see, the PR intervals in the example above are both greater than 0.20 seconds (0.32 for the first PR interval and 0.40 for the second) which also makes them inconsistent (different from the others in the strip). This is likely a 2nd degree type 1 heart block – but you cannot be certain without a full 6 second strip to interpret.
Step 5 – Measuring the QRS Complex
The QRS complex presents depolarization or contraction of the ventricles. The normal interval is 0.06 – 0.12 seconds (1 ½ to 3 small boxes)

In the illustration above, the red lines indicate where you would measure the QRS complex.
In analyzing QRS complexes, we need to ask these 3 questions:
- Are the QRS complexes greater than 0.12 seconds (in width)?
- Are the QRS complexes less than 0.06 seconds (in width)?
- Are the QRS complexes similar in appearance across the EKG strip?
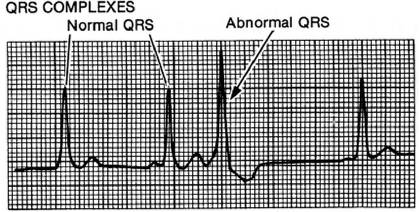
The diagram above shows normal QRS complexes and an abnormal QRS complex (PVC). Narrowing of the QRS complex could be the result of a tachycardia that is happening within or above the bundle branches. Additionally, a widening of the QRS complex is related to a slower spread of ventricular impulses, which is typically the cause of disease or damage to the His-Purkinje conduction system.This could also be a tachycardia – such as a ventricular tachycardia (see part three for more detail on ventricular tachycardia).
Once you master the technique of measuring and analyzing all of the components of an ECG rhythm strip – identifying which rhythm your patient is experiencing will become so much easier! Stay tuned for part three, where we will begin discussing how to identify and interpret heart rhythms!
Best Wishes!
-Damion

- To book your NCLEX Prep Tutoring Sessions – please visit thenursespeak.com today!
- Join our Facebook Group!
- Sign-up for my FREE e-book!
- Never miss another blog post!