
There’s no doubt that the NCLEX can be stressful, especially when there are barriers to being able to comprehend, apply and analyze highly technical concepts and nursing skills. Over the years, a lot of my clients and students have struggled with answering questions that involve ECG interpretation. As a result, I’ve decided to create a three-part blog series that will help you to gain the strategies necessary to master ECG interpretation on the NCLEX.
ECG interpretation can be overwhelming at first because you must go through the process of becoming familiar with the definitions, patterns, rules and methods of measuring the different types of rhythms. Once you are comfortable with the fundamental process of ECG interpretation it becomes substantially easier to quickly identify which rhythm you are dealing with – so that you may begin planning the appropriate nursing interventions.
ECG interpretation, also known as EKG or Telemetry readings, is a great way to analyze and monitor the electrical conduction and functioning of the heart. Since the mechanical function of the heart muscle responds to the electrical stimulation, interpreting the electrical functioning of the heart gives healthcare providers an insight to what might be wrong with someone’s heart when the rhythms fall outside of normal sinus rhythm.
To feel more confident in your understanding of ECG interpretation before you sit for the NCLEX, let’s first go over the basics of how the conduction system of the heart works:

The Conduction System of the Heart
The above image is an illustration of the heart based on the conduction system with the four chambers of the heart labelled – Right Atrium (RA), Right Ventricle (RV), Left Atrium (LA) and Left Ventricle (LV). The first cell is called the SA node, also known as the sinoatrial node, and it is located within the right atrium of the heart. The SA node is also called the “natural pacemaker” of the heart because it is where the start of the conduction or impulse takes place. Next is the AV node, also known as the atrioventricular node and is located at the border of the right atrium and the right ventricle. The AV node is called the “gatekeeper” of the heart because it receives the impulse from the SA node and then signals the ventricles to contract. If for some reason the impulse from the SA Node does not make it to the AV node, the AV node will conduct its own impulse so that the ventricles will still contract – thus delivering blood to the lungs and the body. After the impulse makes its way through the AV node, the conduction continues down through the bundle of his, into the right and left bundle branches, eventually making its way to the end of the conduction system near the apex of the heart, also known as the Purkinje fibers.
Intrinsic Rates
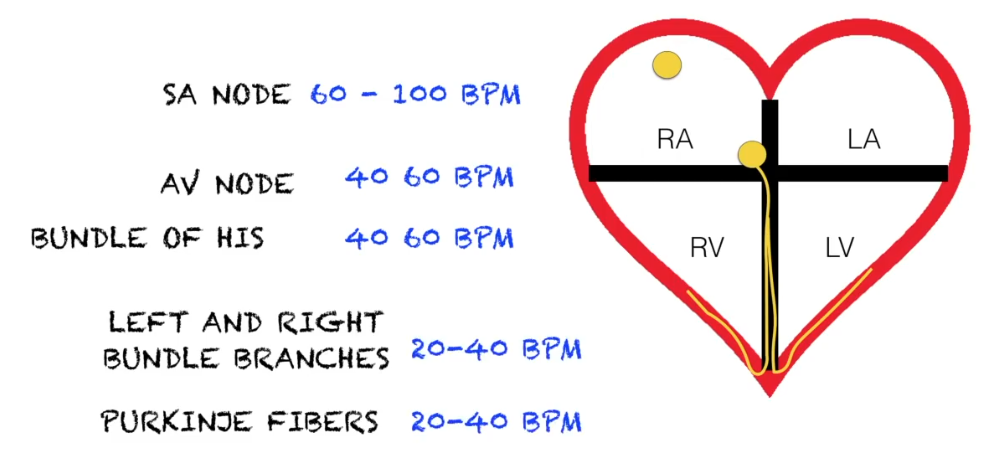
Intrinsic rates are the number of impulses that the conduction system of the heart generates depending on the where the impulse originates. When the heart’s conduction system is healthy and uninfluenced by factors that can impede normal electrical functioning, such as drugs, imbalanced electrolytes, fluid volume deficit, etc., the SA node starts the conduction process where the electrical impulse will travel all the way down to the Purkinje fibers, causing the heart to appropriately contract at the correct times. The SA node generates electrical impulses at 60 to 100 per minute, which is why a normal resting heart rate for an adult is 60 to 100 beats per minute (BPM).
If the SA node is unable to generate a strong enough impulse, or no impulse gets to the AV node from the SA node, the AV node will take over and generate its own impulse. The AV node generates electrical impulses at 40 to 60 per minute, which is why heart blocks typically have a slower heart rate than normal sinus rhythm. When it takes longer for the electrical impulse to travel from the SA node to the AV node, the slower the heart will beat.
If the AV node does not generate an electrical impulse, then the bundle branches will generate their own impulse. The bundle branches generate electrical impulses at 20 to 40 beats per minute. This would typically correlate with worsening heart blocks, and may include 3rd degree heart block – also known as complete heart block – which would be considered an emergency when identified during ECG interpretation.
The Electrical Cardiac Cycle
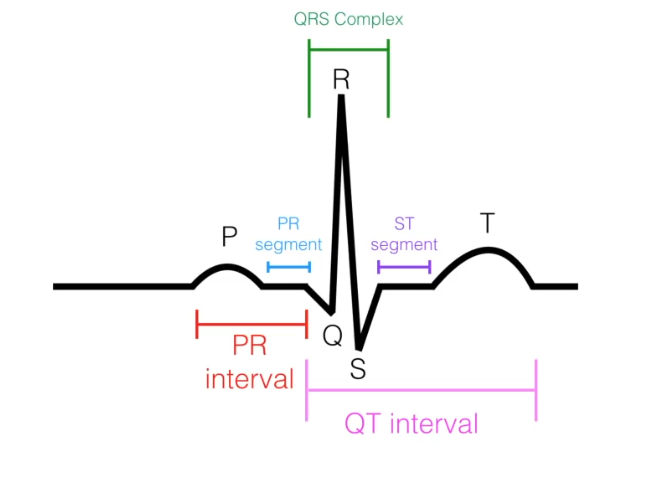
The illustration below shows one fully executed electrical cardiac cycle. The first wave to the left is called the P wave. The structure in the middle is called the QRS complex. The last wave to the right is called the T wave.

P wave – The P wave represents atrial depolarization (SA node electrical impulse firing). During this phase, the mechanical component of the heart responds to the electrical impulse that is fired, and both the right and left atria contract to squeeze blood into the ventricles. .
QRS complex – The QRS complex represents ventricular depolarization (AV node electrical impulse firing). During this phase, the mechanical component of the heart responds to the electrical impulse that is fired, and both the right and left ventricles contract to squeeze blood to the lungs and out to the body.
T wave – The T wave represents ventricular repolarization (AV node, Bundle of HIS, and Purkinje fibers recharging). During this phase, both the right and left ventricles are relaxing and refilling with blood.
So you may ask – “Where is atrial repolarization represented in the ECG?”

The answer is that you can’t actually identify a wave that represents atrial repolarization during ECG interpretation because it happens at the same time when ventricular depolarization takes place. During ventricular depolarization, the electrical impulse of the ventricles is so powerful that it overshadows the small wave that would represent atrial repolarization. So while the ventricles are contracting and squeezing blood to the lungs and body, the atria are relaxing, recharging and filling with blood.

To review, the P wave represents atrial depolarization which stimulates the atria to contract. The QRS complex represents ventricular depolarization which stimulates the ventricles to contract. While the ventricles are contracting, the atria are recharging (repolarization), relaxing and filling with blood. The atrial repolarization cannot be identified on an ECG tracing because it is hidden behind the QRS complex. Lastly, the T wave represents ventricular repolarization, in which the ventricles are relaxed, recharging and filling with blood.
Now that we’ve gone over how the conduction system of the heart works, and how to identify the waves on an ECG tracing, let’s further discuss the process of measuring during ECG interpretation. In order to do that, we need to define intervals and segments.
An interval is the duration of time that includes one segment and one or more waves.
A segment is the duration of time between two waves.
In the illustration above, there are two intervals:
- PR interval
- QT interval
There are also two segments:
- PR segment
- ST segment
Let’s discuss what each interval and segment means in relation to what’s happening in the electrical system of the heart:
PR interval – This represents the total time it takes for the SA node’s electrical impulse to travel from the SA node, through the atrium and to the AV node.
PR segment – This represents completion of atrial depolarization, where all electrical activity falls onto the isoelectric line, and is the segment just before the QRS complex (ventricular depolarization).
QT interval – This represents beginning of ventricular depolarization through the plateau phase to the ventricular repolarization. In other words, it reflects all of the electrical ventricular activity.
ST segment – This represents completion of ventricular depolarization, where all electrical activity falls onto the isoelectric line, and is the segment just before the T wave (ventricular repolarization).
Understanding how to Measure using ECG Tracing Paper
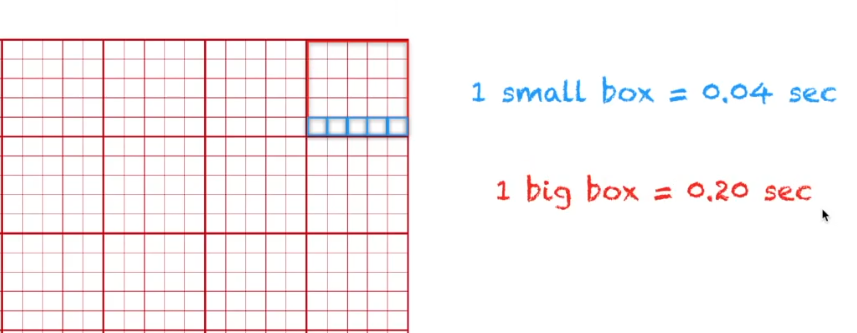
Let’s wrap up by discussing ECG tracing paper. In order to be able to measure the length of time it takes for conduction to occur within the heart’s electrical system, the ECG paper has been designed to help make this easier. Firstly, it is important to know that the ECG tracing paper helps us measure two things:
- Time – from left to right
- Milivolts – from bottom to top
When you print out a strip of ECG tracing paper, you are looking at a snapshot of what the heart was doing – therefore it is in the past. We always measure from left to right to adequately account for the time it takes for the electrical impulses to move through the conduction system of the heart. When you see a computerized image of the heart cycle waves, such as watching a cardiac monitor, you are seeing what the heart is doing in real time.
The ECG tracing paper has big boxes with a row of 5 smaller boxes inside. Every small box represents 0.04 seconds in time. Five of those small boxes in a row represents 0.20 seconds in time. Once you commit these values to memory, It becomes really easy math: 0.04 seconds x 5 = 0.20 seconds.
It is essential that you feel comfortable with the information presented in part one of this NCLEX ECG Interpretation Made Easy article. Stay tuned because In part two, we will go over definitions and specific measurements that will help you to quickly and easily identify which rhythm you are looking at on an ECG Rhythm Strip.
Best Wishes!
-Damion